
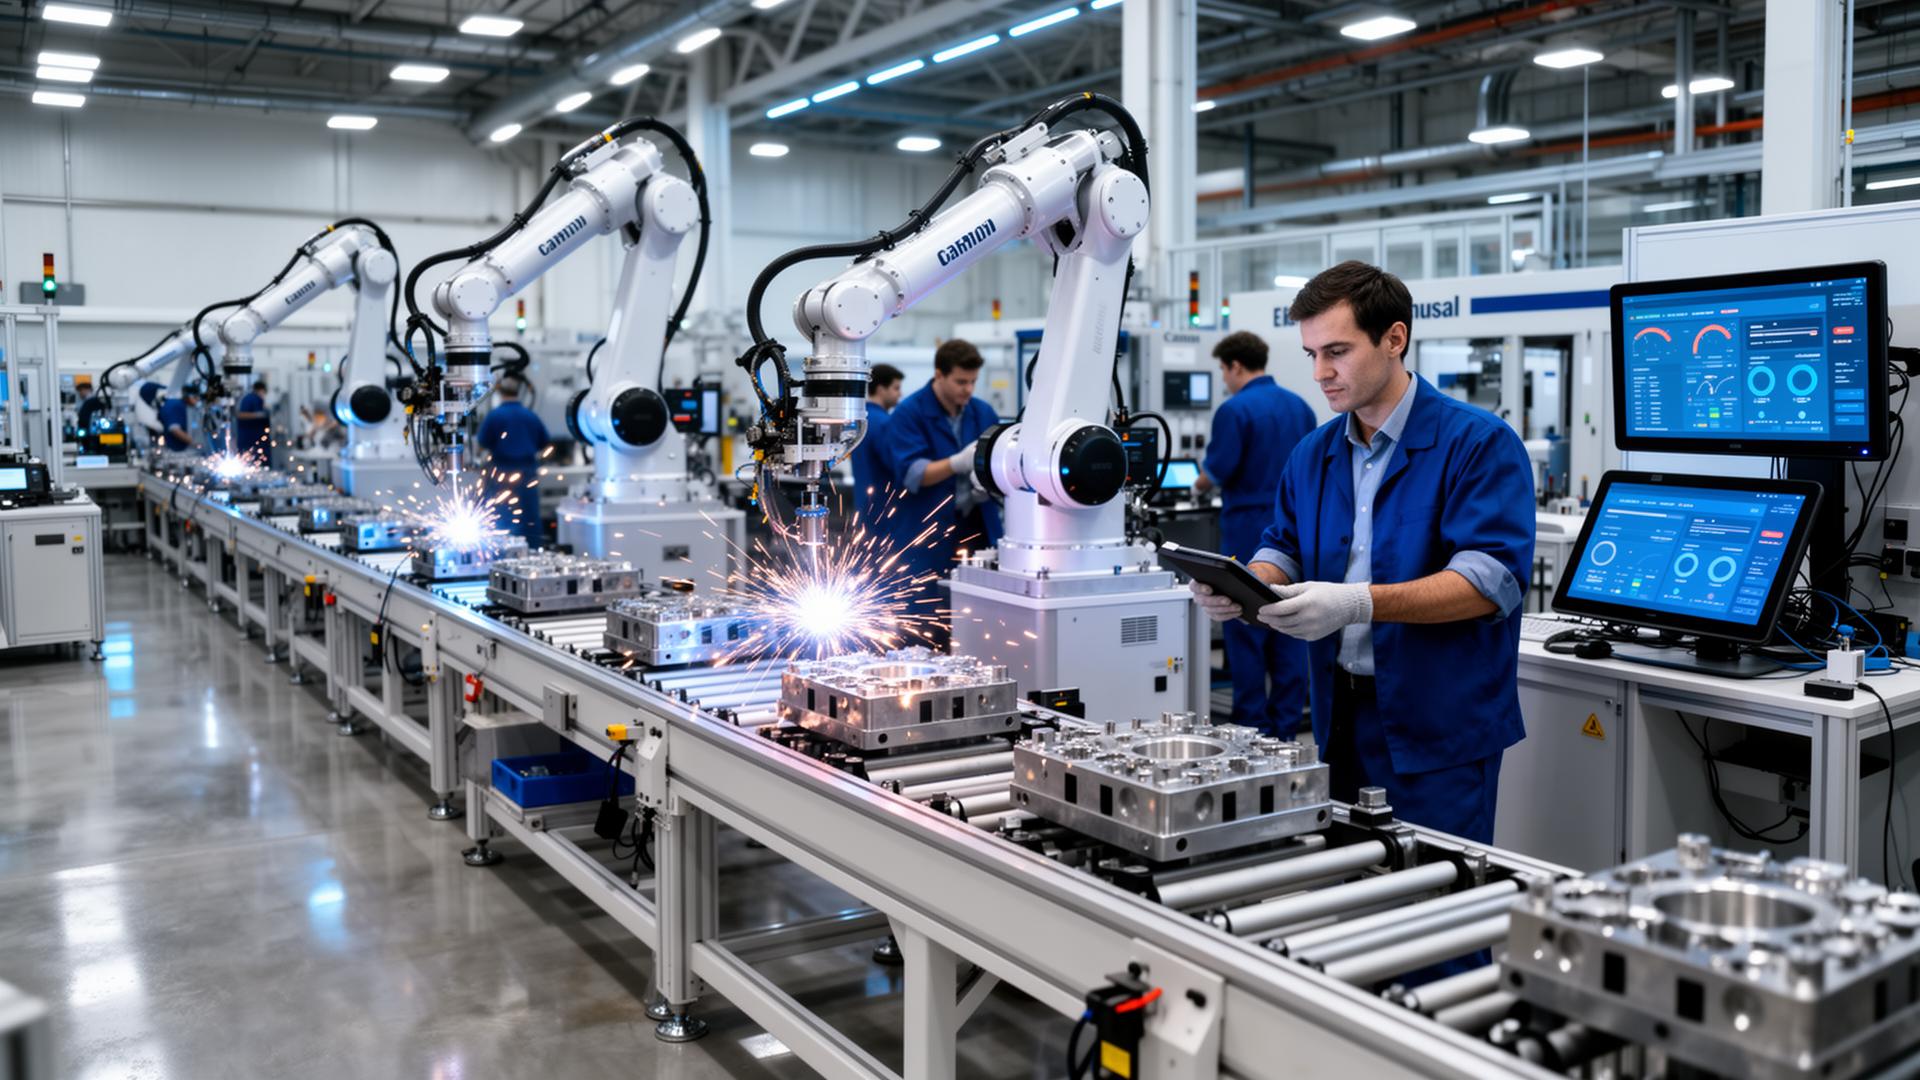
Manufacturing Platform
An industrial decision system for plants, fleets, and production networks.
How this platform works in everyday language.
Heavy industrial plants, cement factories, mines, and processing mills lose millions of dollars when machines break down unexpectedly or when raw materials produce poor quality output. Plant managers spend hours walking through control rooms checking gauges, while corporate headquarters only sees monthly spreadsheets. Cerebro Dynamics Manufacturing creates a live digital twin of your plant. It reads thousands of sensors from motors, boilers, conveyor belts, and chemical mixers every second. Operators get early warnings weeks before a bearing fails, adjust temperatures to save energy, and maintain peak output.
What this platform addresses.
Plant data, ERP, quality systems, and field telemetry rarely combine into a clear operating picture, slowing response and obscuring root cause. Cerebro Dynamics Manufacturing closes the loop between physical reality and engineering decisions.
Who uses this platform in daily work.
Examines vibration and temperature telemetry on heavy rotating turbines to schedule maintenance before costly breakdowns.
Traces raw material batches through refining stages to pinpoint why specific production runs suffered quality drops.
Tracks electrical power usage and boiler fuel consumption in real time to lower utility bills and carbon footprints.
Compares production speed, downtime, and worker safety metrics across multiple regional factories from one tablet.
How the system is built.
Digital twin and process intelligence fabric with closed-loop feedback to operational systems, OT segregation, and signed deployments.
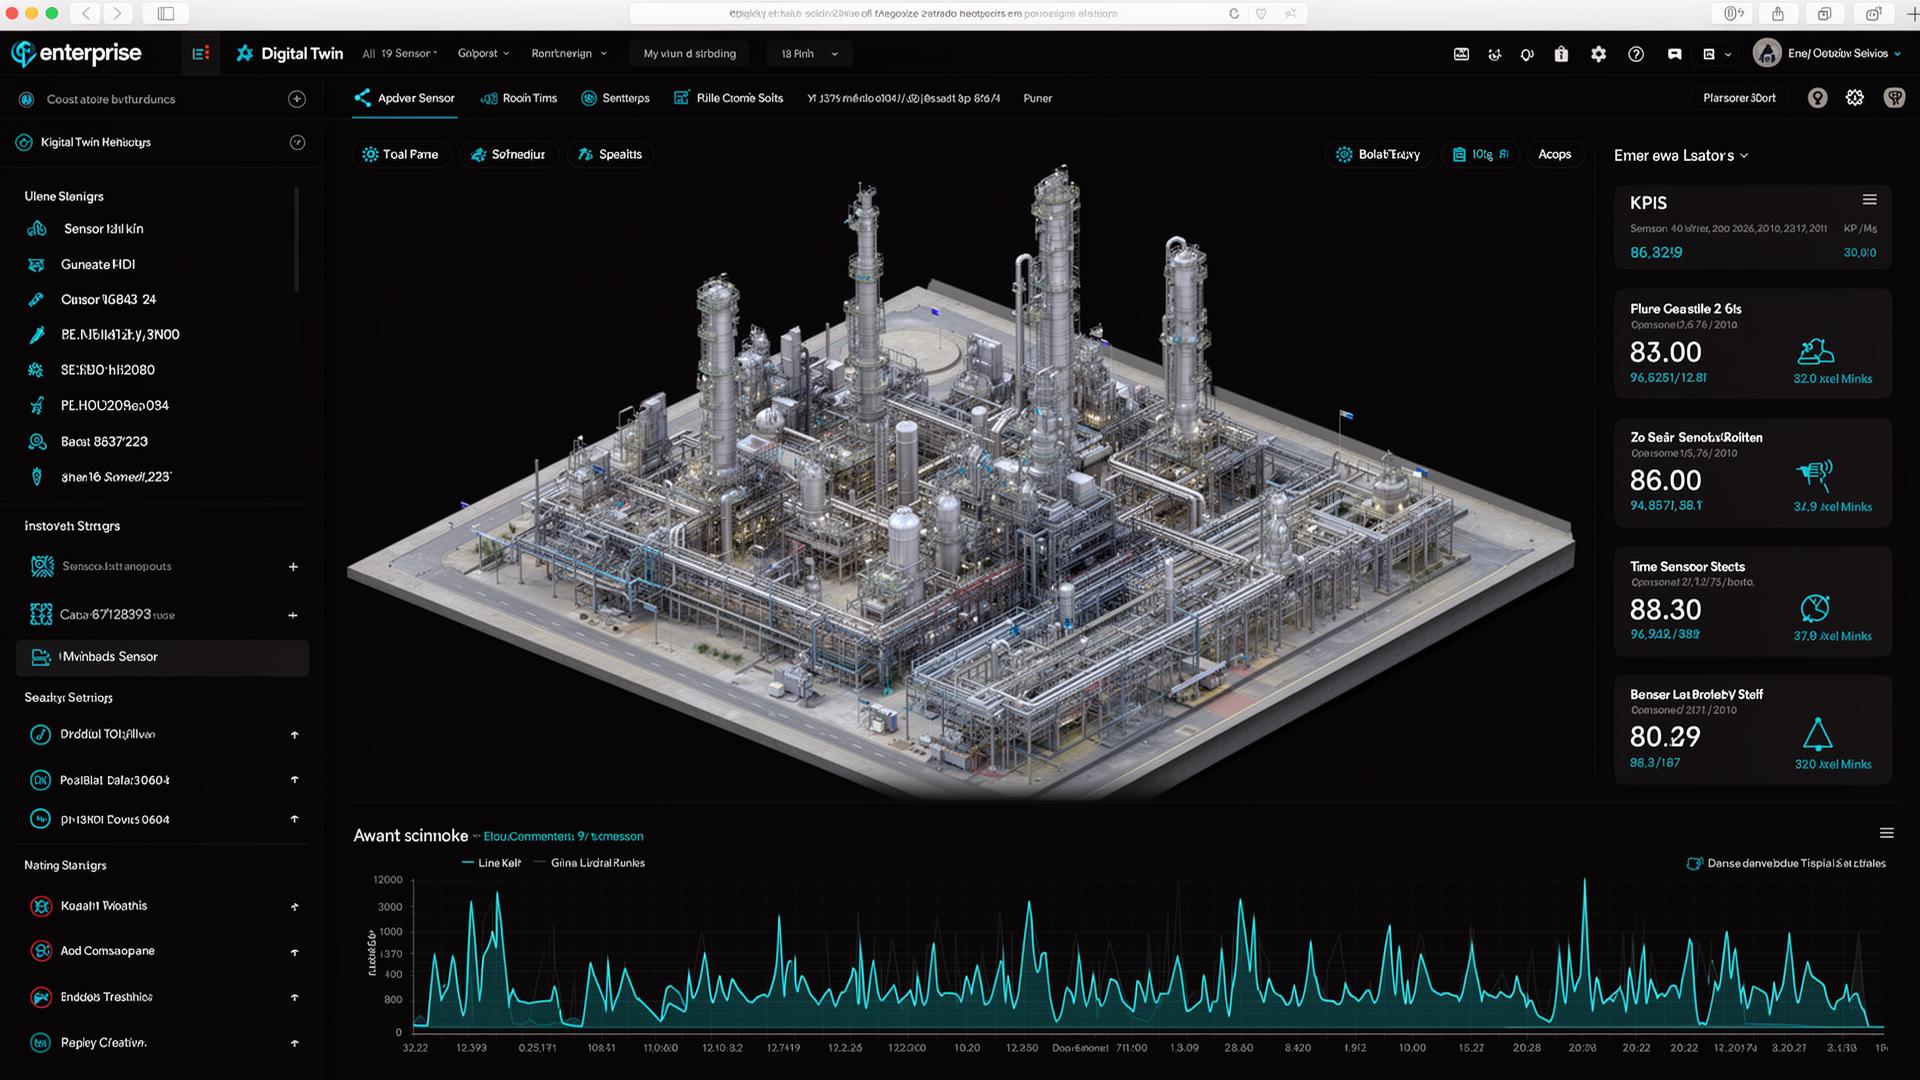
What ships in the platform.
Live digital twin across process and discrete.
Genealogy, root cause, and quality control.
Early failure detection across assets.
Energy and emissions accounting.
What it does.
- 01Plant digital twins (process and discrete)
- 02Quality and yield analytics
- 03Predictive maintenance
- 04Energy and emissions monitoring
- 05Process optimization (closed loop)
- 06Genealogy and traceability
Real-world operational examples.
Preventing Catastrophic Mill Failure in a Gold Mining Plant
A primary ball mill grinding mineral ore suffered sudden gearbox fractures that shut down processing operations for eighteen days.
Engineers installed wireless vibration sensors tied to the Plant Twin module. The system identified micro-frequency changes forty-eight hours before mechanical failure, allowing mechanics to replace a worn drive bearing during scheduled downtime without stopping processing.
Optimizing Power Consumption in a Cement Manufacturing Line
Kilns and raw mills consumed immense amounts of electricity during peak tariff hours, creating high production costs.
The Energy Ledger module automated mill speed adjustments based on utility pricing tiers. By shifting high-power grinding cycles to off-peak nighttime hours, the facility reduced its monthly energy bill by fourteen percent.
A typical operating loop.
An engineer detects a quality drift, traces it through the twin to a specific subprocess, simulates a correction, and applies it through controlled change management.
Data model.
OT, ERP, MES, and IoT data with industrial ontologies and OPC connectivity.
Posture.
OT segregation, signed deployments, and integrity controls aligned with industrial standards.
DeploymentOn-premise, hybrid, or sovereign cloud.
What operators ask before deployment.
Where it is deployed.
- Manufacturing and Industrial
- Logistics and Transport